Multiple methods exist to measure the performance of a classification algorithm and classify a data set into two classes, positive and classified. The terminology was developed in the medical field, where positive denotes the presence of a disease and negative indicates its absence 1.
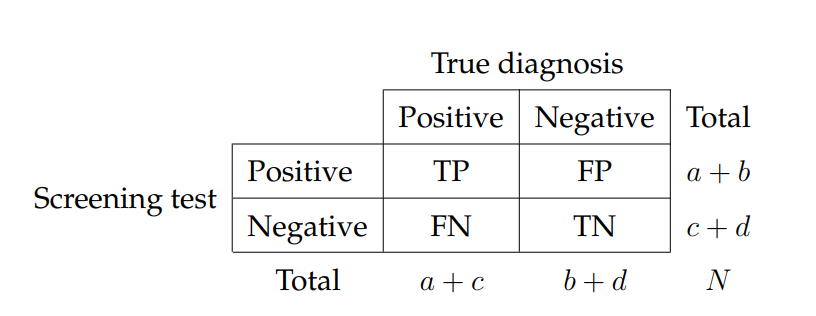
In a test data set D with n instances, a classifier tries to identify the class of instances for binary classifiers, whereby four possibilities exist. These possibilities for any classifier can be demonstrated as a confusion matrix, which is shown in Table \ref{tab:confusionMatrix}, and explained below 2:
- True Positive TP: Number of correctly identified positive cases by the classifier.
- False Positive FP: Number of incorrectly identified cases as positive but their true labels are negative.
- True Negative TN: Number of correctly identified negative cases by the classifier.
- False Negative FN: Number of incorrectly identified cases as negative but their true labels are positive.
To measure the overall performance of a classifier directly from the confusion matrix we can calculate the accuracy and error rates. The accuracy of a classifier is the fraction of correctly classified instances so that: Accuracy = (TP + TN)/n. In contrast, the fraction of all misclassified instances comprise the error rate which is: Error Rate = (FP + FN)/n 1.
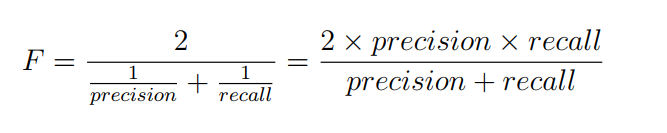
To measure class-specific performance we can use recall and precision. Recall is the ratio of correctly predicted number of a class labels to the real number of instances of that class in the data set. Recall for the positive instances in the data set is called sensitivity. The sensitivity is the ratio of true positive to the real number of positive cases in the data set so that sensitivity = TP/(TP + FN). Precision is a class-specific accuracy; it is the ratio of the number of correctly predicted instances of a class to the number of predicted instances of the same class. A specific case of precision for the negative class is called specificity. The specificity is the ratio of true negative to the real negative cases in the data set so that specificity = TN/(TN + FP) 1.
For a classifier, there is a trade-off between recall and precision; maximising one of them might cause the other to decline. Consequently, measures are introduced to overcome this problem and create a balance between these two measures. F-measure is computing the harmonic mean of the classes’ recall and precision 2 so that:
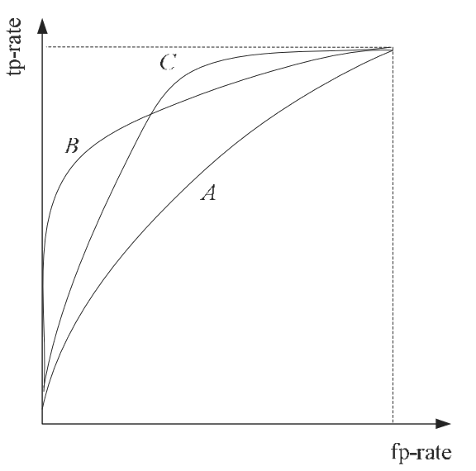
Area Under the Curve (AUC) of receiver operating characteristic (ROC) is a measure used to calculate the performance of machine learning algorithms such as classification 3 . The ROC curve is a graph of the true positive and false positive rates of the predicted classifier’s result compared to the real class for each item. Figure 2.6 shows ROC curves for different algorithms with various performances. AUC is the area under the ROC curve plotted as a performance result of the classifier. Methods of calculating AUC vary according to the nature of application and available data. The multi-class AUCs are calculated using the equations of 4. auc = [2/c(c-1)] ∑ aucs. Where c is number of classes and aucs is a set of auc between any two classes.
Reference
-
Fawcett, T. (2006) ‘An introduction to ROC analysis’, Pattern Recognition Letters, 27(8), pp. 861–874. doi: 10.1016/j.patrec.2005.10.010. ↩ ↩2 ↩3
-
Zaki, M. J. and Meira, M. J. (2014) Data Mining and Analysis: Fundamental Concepts and Algorithms, Cambridge University Press. New York: Cambridge University Press. ↩ ↩2
-
Bradley, A. P. (1997) ‘The use of the area under the ROC curve in the evaluation of machine learning algorithms’, Pattern Recognition, 30(7), pp. 1145–1159. doi: 10.1016/S0031-3203(96)00142-2. ↩
-
Hand, D. D. J. and Till, R. J. R. (2001) ‘A simple generalisation of the area under the ROC curve for multiple class classification problems’, Machine Learning, pp. 171–186. ↩