When I published the R edition of From Data to Thesis, the goal was to teach research statistics around a person and a research problem rather than a catalog of isolated tests. Many graduate students and researchers, however, work in departments or labs where Python is the shared language—especially when a thesis touches machine learning, natural language processing, or software systems alongside survey and experimental data.
For those researchers, most introductory Python books pose the opposite problem: they teach Python as general software engineering first, leaving a non-technical researcher to piece together pandas, seaborn, scipy, statsmodels, and scikit-learn on their own when their thesis data arrives.
From Data to Thesis: Using Python for Non-Technical (polla.dev/data2thesis_python) takes the same longitudinal case study—Elaf’s Master’s thesis following 600 graduate students across four semesters—and rebuilds the entire nineteen-chapter curriculum natively in the scientific Python ecosystem, with its own installable data2thesis Python package (pip install data2thesis), lecture slides, and in-browser playground.
One research story, a different ecosystem
In R, statistical modeling is built into the core language, so the journey feels unified from the start. In Python, a researcher relies on a coordinated stack of specialized libraries: pandas and numpy for tabular structures, seaborn and matplotlib for graphics, scipy.stats and statsmodels for classical inference and formula-based regression, and scikit-learn for predictive modeling.
Rather than hiding those boundaries, the book uses Elaf’s research questions to explain why each library exists and when to reach for it:
- Explanation versus prediction becomes a concrete shift in tools as well as thinking: Chapters 8–10 use
statsmodelsformulas (smf.ols,smf.logit,smf.mixedlm) when the research question asks how strongly sleep and supervisor support relate to grades or wellbeing, whereas Chapters 11–15 switch toscikit-learnpipelines (ColumnTransformer,Pipeline,GridSearchCV) when the university asks which first-semester students are at risk of dropping out next year. - Data cleaning as an auditable chain: instead of scattered spreadsheet edits, Chapter 3 uses readable
pandasmethod chains (.query(),.assign(),.replace(),.melt(),pd.merge()) so that every removed duplicate, recoded missing value (99and-9), and reverse-scored Likert item (6 - q["stress_4"]) is recorded in order.
Part 1: Foundations of Python and data handling (Chapters 1–4)
1. Getting Started with Python. The book begins in VS Code (with Positron and Jupyter alongside it), virtual environments, and pip. Introducing project folders and environments on day one saves non-technical researchers from the most common Python frustration: packages installed in one place and scripts running in another.
2. Data Structures in Python. Before DataFrame indexing with .loc and .iloc or ordered pd.Categorical variables, the chapter asks what a measurement represents. It shows how to import CSV, Excel, and SPSS (.sav) files while preserving variable labels, translates familiar Excel and SPSS habits into pandas, and teaches readers to read Python tracebacks (KeyError, TypeError, NameError) from the bottom line up rather than panicking at a wall of red text.
3. Data Manipulation. Elaf’s raw export (wellbeing_raw.xlsx) has 615 rows for 600 students, mixed text and numeric entries, impossible sleep hours, and four semesters packed into 64 wide columns. Walking through the cleanup in pandas shows that data cleaning is not a chore before the real work—it defines who is in the sample and what the constructs mean.
4. Data Visualization. Built around seaborn and matplotlib, the chapter pairs perceptual hierarchy (why position and length beat angle and area) with practical control over axes, baselines, small multiples (FacetGrid), and high-resolution export (plt.savefig(bbox_inches="tight")).
Part 2: Statistical analysis for research (Chapters 5–10)
5. From Research Question to Data and 6. Descriptive Statistics and Exploratory Data Analysis establish study design, measurement reliability and validity, sampling variation, skewness, outliers, and missing-data mechanisms (MCAR, MAR, MNAR)—including attrition across Elaf’s four semesters—before running a single hypothesis test.
7. Hypothesis Testing and Statistical Inference combines numpy simulations (permutation tests and bootstrap confidence intervals) with scipy.stats (ttest_ind, ttest_rel, mannwhitneyu, chi2_contingency) and effect sizes (Cohen’s d), emphasizing the difference between a small p-value and a meaningful effect.
8. ANOVA and Regression and 9. Multivariate Statistical Methods move from one- and two-way ANOVA (anova_lm, Tukey HSD) and multiple/logistic regression in statsmodels to principal component analysis, exploratory factor analysis of Elaf’s multi-item scales, Cronbach’s alpha, and hierarchical and k-means clustering.
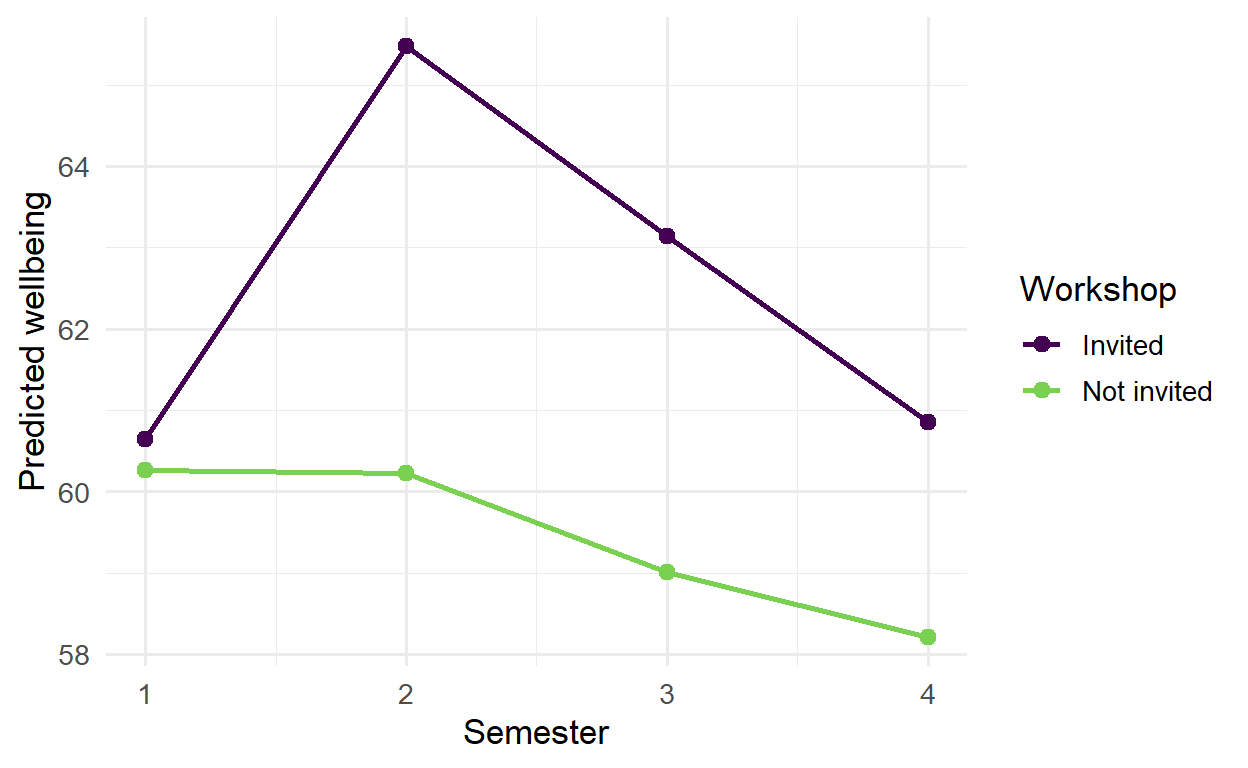
10. Mixed-Effects Models. Longitudinal and nested data violate the independence assumption of ordinary regression. Fitting linear mixed-effects models (smf.mixedlm) to Elaf’s four-semester records reveals a pattern that a single cross-section would miss: students invited to the wellbeing workshop show a clear jump in semester 2, but the gap narrows over semesters 3 and 4 as the initial boost fades.
Part 3: Machine learning with Python (Chapters 11–16)
This part is where Python’s scikit-learn ecosystem shines, provided a researcher learns how to avoid fooling themselves.
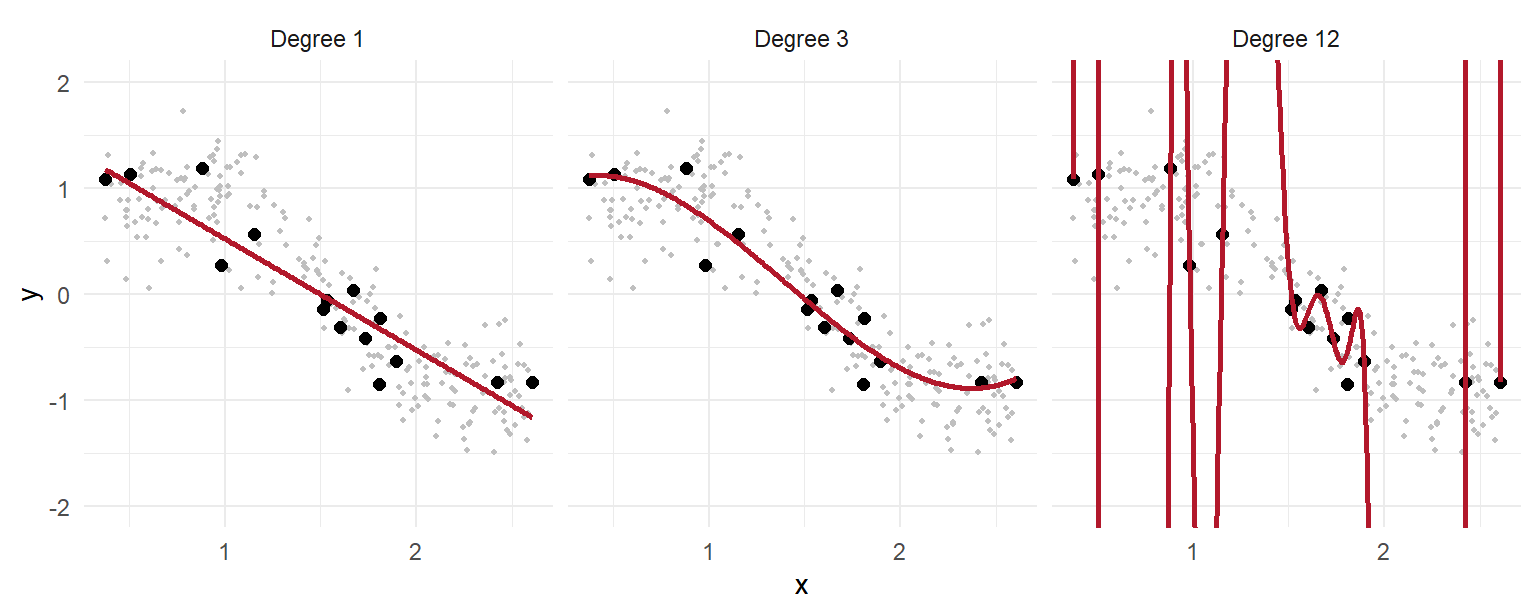
11. Introduction to Machine Learning in Python. Using polynomial fits on simulated data before touching Elaf’s dataset, the chapter makes overfitting and the bias-variance trade-off visual. It introduces train_test_split, ColumnTransformer, and Pipeline not as boilerplate syntax, but as the mechanism that prevents data leakage during cross-validation: imputation and scaling are fitted inside each fold, never on the whole dataset first.
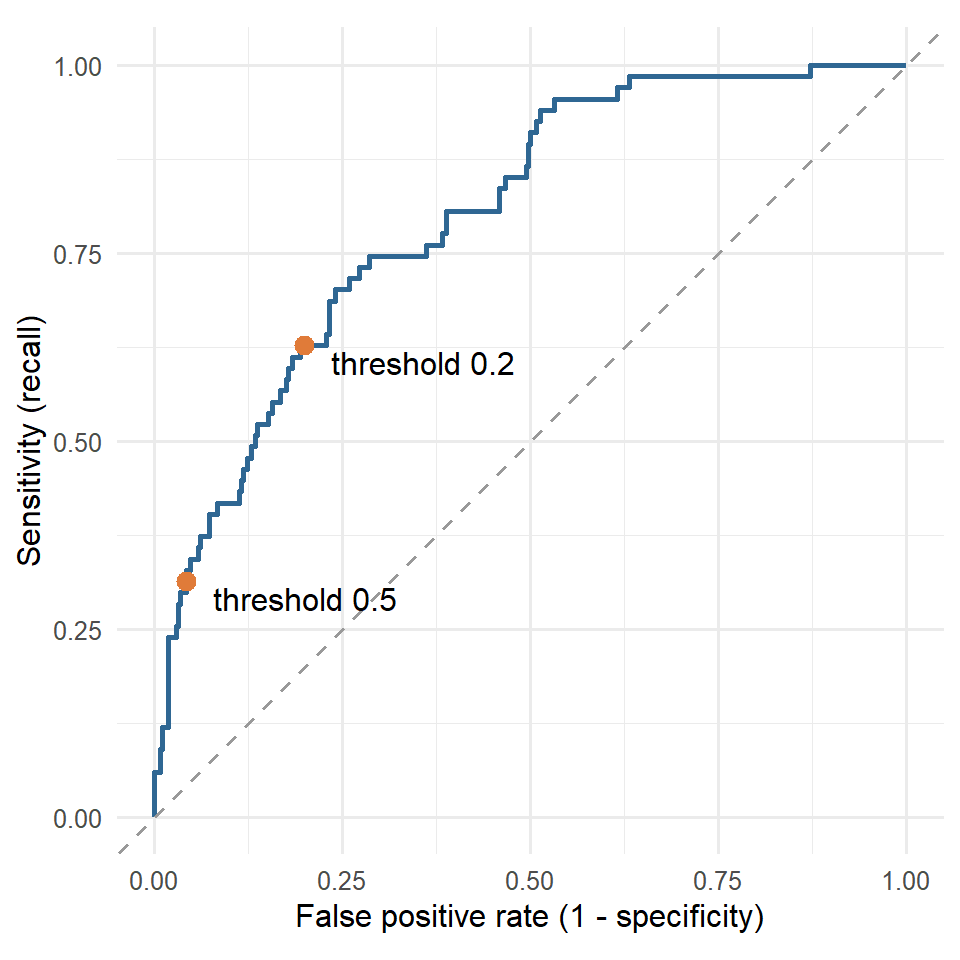
12. Classification Models. Decision trees, random forests, k-nearest neighbors, and support vector machines are compared on predicting student dropout consideration. Because dropout is an imbalanced outcome, overall accuracy is a trap. The chapter walks through confusion matrices, ROC curves, and threshold selection—showing what happens when the decision threshold is moved from 0.5 to 0.2 to catch more students who need support, and what that trade-off costs in false alarms.
13. Predictive Regression (ridge, lasso, elastic net, and gradient boosting for predicting final GPA), 14. Advanced Clustering (Gaussian mixture models with BIC and DBSCAN for density-based clusters and noise points), 15. Neural Networks (multilayer perceptrons in scikit-learn and when deep learning in PyTorch or Keras is—and is not—justified for tabular survey data), and 16. Time Series Forecasting (decomposition, ETS, and ARIMA on weekly university counseling visits) complete the modeling arc.
Part 4: Reproducible research, AI coding, and the finished thesis (Chapters 17–19)
17. Reproducible Research. Three weeks before submission, Elaf’s supervisor notices twelve duplicate rows from an early export. If tables and numbers were copied by hand into Word, every figure and sentence has to be hunted down and rechecked. This chapter shows how Quarto (.qmd), pinned requirements.txt environments, and interactive Shiny for Python dashboards keep code, prose, and figures synchronized from raw data to final PDF or Word thesis.
18. Using AI with Python. Beyond using LLMs to explain and debug Python code, this chapter tackles a real methodological task from Elaf’s survey: 536 open-ended written responses to “What has been your biggest challenge during your studies?” After Elaf codes 200 responses by hand using a codebook, the chapter calls a language model from Python (including local models via Ollama for data privacy) to classify the texts into structured themes—and then evaluates the AI coder against human benchmark labels using confusion matrices and Cohen’s kappa rather than taking the model’s output on faith.
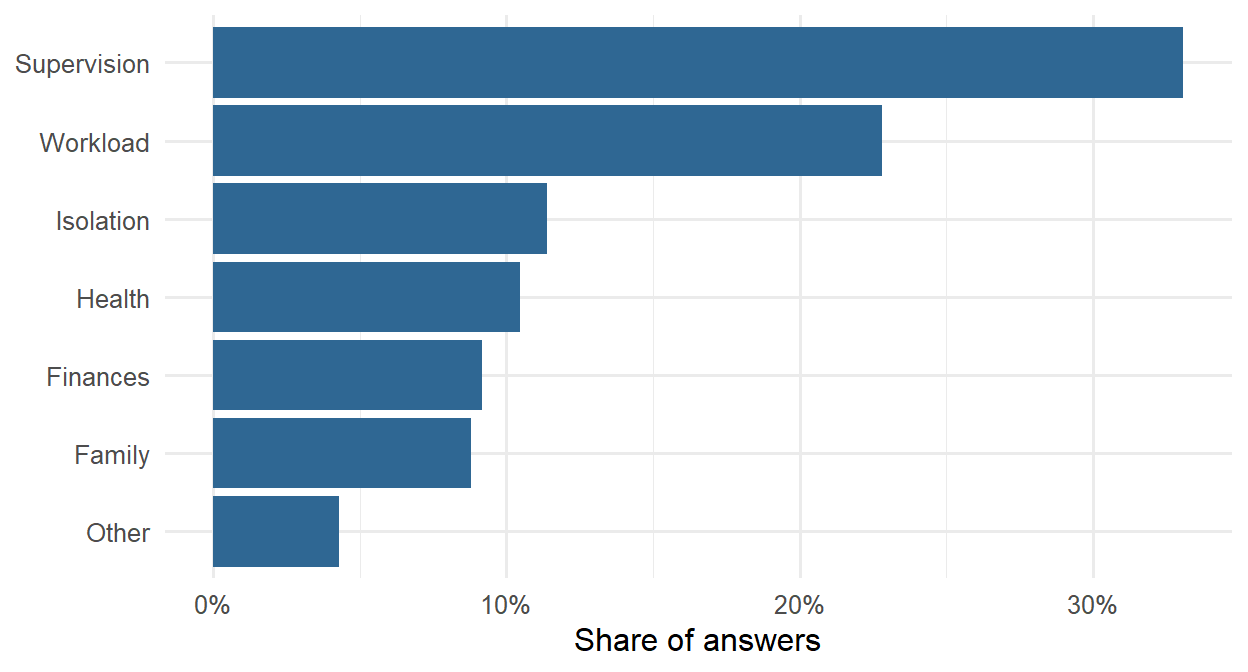
19. Putting It All Together. The closing chapter assembles the entire project into a clean, end-to-end repository that runs from the raw Excel export to the final results chapter, with a decision guide mapping research questions to statistical and machine learning methods.
The complete book, downloadable PDF, lecture slides, interactive playground, and data2thesis Python package are freely available at polla.dev/data2thesis_python.