flowchart TB
  subgraph R1[" "]
    direction LR
    A["Question and design<br>Ch 5"] --> B["Import<br>Ch 1–2"] --> C["Clean<br>Ch 3"] --> D["Explore<br>Ch 4, 6"]
  end
  subgraph R2[" "]
    direction LR
    E["Test and model<br>Ch 7–10"] --> G["Report and share<br>Ch 17–18"]
    F["Predict and discover<br>Ch 11–16"] --> G
  end
  R1 --> R2
Putting It All Together
Putting It All Together
From the raw export to the last table, as one project
Chapter 19
Polla Fattah
By the end of today you can
- organise a project that runs from raw data to finished results;
- combine cleaning, description, modelling, and visualisation in one pipeline;
- trace the chain of reasoning from question to conclusion and limitation;
- report results as a thesis expects, following published standards;
- choose a method for a research question;
- recognise common challenges, and know where to learn more.
A thesis is an argument
The results chapter is the evidence.
Each claim rests on a chain: question, hypothesis, design, variables, analysis, result, conclusion, limitation.
It convinces when every link can be seen, and every number traced back to the raw data.
Rebuild it as one project
Analyses written over two years, as each method was learned, are scattered across scripts.
Before writing the results chapter: rebuild everything, from the raw export to the last table, as one project that runs from start to finish.
Then every number is right, and any examiner’s question can be answered by pointing to the code.
The shape of a research project
Not a straight line, but code makes going back easy.
Organising the project
wellbeing-thesis/
├── wellbeing-thesis.Rproj      the RStudio Project
├── README.txt                  what it is and how to run it
├── data-raw/wellbeing_raw.xlsx the export, never edited by hand
├── data/                       clean data, created by scripts
├── R/01-clean-data.R           raw export -> clean tables
├── R/02-analysis.R             models and figures
├── output/                     figures and tables, created by scripts
├── results.qmd                 the results chapter
├── references.bib
└── renv.lock                   package versions
Four principles
| Principle | Means |
|---|---|
| raw data is read-only | data/ and output/ can be deleted and recreated |
| scripts are numbered | in running order, one job each |
| paths are relative | here::here() works on any computer |
| a README | a few lines on what the project is and how to run it |
The downloadable Chapter 19 project has exactly this structure.
From raw export to clean data
responses <- raw |>
  filter(!str_detect(str_to_upper(`Q1_Student ID`), "^TEST")) |>
  select(-`Response ID`) |>
  distinct() |>
  rename(student_id = `Q1_Student ID`, workshop = `Workshop group`,
         considering_dropout = `Y1_Considered leaving?`) |>
  rename_with(~ item_names, .cols = Q11_1:Q11_22) |>
  mutate(across(all_of(item_names), ~ as.integer(na_if(.x, "99"))))
The cleaning of Chapter 3 in one script: it runs in seconds.
The semester records
semesters_clean <- responses |>
  select(student_id, matches("_S[1-4]$")) |>
  pivot_longer(-student_id, names_to = c(".value", "semester"),
               names_sep = "_S") |>
  mutate(sleep_hours = parse_number(str_replace(sleep_hours, ",", ".")),
         sleep_hours = if_else(sleep_hours > 24, NA, sleep_hours),
         gpa         = if_else(gpa > 4, NA, gpa)) |>
  filter(!if_all(gpa:wellbeing, is.na))
The most important line: the check
same(questionnaire_clean |> arrange(student_id),
     questionnaire |> arrange(student_id))
#> [1] TRUE
same(semesters_clean |> arrange(student_id, semester),
     semesters |> arrange(student_id, semester))
#> [1] TRUE
In a real project there is nothing to compare with: check counts, ranges, missing values, and a few rows (Chapters 3 and 6).
One analysis table
study <- students |>
  left_join(scores, join_by(student_id)) |>
  left_join(semesters |> filter(semester == 1), join_by(student_id))
One row per student: background, questionnaire scores, and first-semester records.
Helper functions instead of copy and paste
mean_sd <- function(x) sprintf("%.1f (%.1f)", mean(x, na.rm = TRUE),
                                               sd(x, na.rm = TRUE))
percent <- function(x) sprintf("%.0f%%", 100 * mean(x, na.rm = TRUE))

describe <- function(d) {
  tibble(Characteristic = c("Students", "Age, mean (SD)", ...),
         Value = c(nrow(d), mean_sd(d$age), ...))
}
The same describe() makes every column. Write a small function whenever you would copy and paste.
Table 1: the sample
| Characteristic | Master’s | PhD | All |
|---|---|---|---|
| Students | 426 | 174 | 600 |
| Age, mean (SD) | 27.9 (3.3) | 34.2 (5.1) | 29.7 (4.8) |
| Women | 52% | 53% | 52% |
| Part-time | 26% | 39% | 30% |
| Stress (1-5), mean (SD) | 3.2 (0.7) | 3.2 (0.7) | 3.2 (0.7) |
| Support (1-5), mean (SD) | 3.2 (0.8) | 3.2 (0.7) | 3.2 (0.8) |
| Wellbeing, semester 1 | 60.9 (12.1) | 59.3 (11.9) | 60.5 (12.0) |
| Considered dropping out | 15% | 14% | 15% |
Formatting p-values
format_p <- function(p) {
  if (p < 0.001) "p < .001"
  else paste("p =", sub("^0", "", sprintf("%.3f", p)))
}
Theses report p-values in a fixed style. A function applies it every time, without mistakes.
RQ3: the workshop and its persistence
workshop_model <- lmer(wellbeing ~ factor(semester) * workshop +
                         (time | student_id), data = panel)
gaps$wellbeing <- predict(workshop_model, newdata = gaps, re.form = NA)
Wellbeing was similar before the workshop (difference 0.4 points). Invited students’ wellbeing was 5.2 points higher in semester 2, narrowing to 4.1 in semester 3 and 2.6 in semester 4.
RQ5: explaining GPA
gpa_model <- lm(gpa ~ sleep_hours + study_hours + stress + support,
                data = study)
gpa_table <- tidy(gpa_model, conf.int = TRUE)
Each additional hour of sleep was associated with a GPA 0.11 points higher (95% CI 0.08 to 0.13, p < .001), holding study hours, stress, and support constant. The four predictors explained 25% of the variation (n = 587).
RQ9: considering dropout
dropout_model <- glm(
  I(considering_dropout == "Yes") ~ stress + support + financial_worry +
    employment + study_mode, data = study, family = binomial)
tidy(dropout_model, conf.int = TRUE, exponentiate = TRUE)
Each one-point increase in stress was associated with 3.6 times the odds of considering dropping out (95% CI 2.3 to 5.9); each point of support with 0.33 times the odds.
I() uses a condition as the outcome; exponentiate = TRUE gives odds ratios.
One figure for the thesis
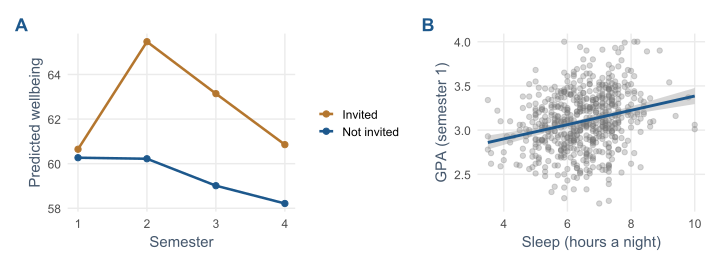
patchwork: + side by side, / stacked, & applies a theme to all panels.
Saving the figure
(panel_a + panel_b) +
  plot_annotation(tag_levels = "A") &
  theme_minimal(base_size = 12)

ggsave(here::here("output", "figure-1.png"),
       width = 18, height = 8, units = "cm", dpi = 300)
At the size and resolution the thesis requires (Chapter 4).
A result is not yet a conclusion
Between them lie:
- the design that produced the data;
- how the variables were measured;
- the limits of both.
The chain of reasoning makes each link visible.
The chain of reasoning: question to analysis
| Step | Workshop (RQ3) | GPA (RQ5) | Dropout (RQ9) |
|---|---|---|---|
| hypothesis | invited higher in semester 2 | more sleep, higher GPA | stress raises the odds |
| design | randomised, longitudinal | observational | observational |
| analysis | mixed model | multiple regression | logistic regression |
The chain of reasoning: result to limitation
| Step | Workshop (RQ3) | GPA (RQ5) | Dropout (RQ9) |
|---|---|---|---|
| result | +5.2 in sem. 2, +2.6 by sem. 4 | 0.11 per hour of sleep | OR 3.6 per point of stress |
| conclusion | causal: the effect faded | an association | an association |
| limitation | one university; invitation, not attendance | self-reported sleep; unmeasured confounders | considering, not leaving |
Only the workshop was randomised, so only its conclusion is causal.
The results chapter
The tables, figures, and sentences go into results.qmd, with every number written as inline code (Chapter 17).
When the data changes, or an examiner asks for a different model, the code changes and the chapter renders again.
Reporting standards
| Standard | For |
|---|---|
| APA JARS | quantitative research in psychology and related fields |
| CONSORT | randomised trials in health research |
| STROBE | observational studies |
They list what readers need to judge a study, including effect sizes and confidence intervals. Check your draft against the relevant one.
Choosing a method: the goal
flowchart LR
  Q{What is the goal?} -->|Describe| D["Summaries and plots, Ch 4, 6"]
  Q -->|Explain or compare| O["Next slide"]
  Q -->|Predict new cases| P["Machine learning, Ch 11–15"]
  Q -->|Find structure| U["PCA, factors, clusters, Ch 9, 14"]
  Q -->|Forecast over time| T["Time series, Ch 16"]
Choosing a method: explaining or comparing
flowchart LR
  O["Outcome type?"] -->|Numeric| N["Repeated or nested data?"]
  O -->|Yes / No| L["Chi-square, logistic regression, Ch 7–8"]
  N -->|No| R["t-test, ANOVA, regression, Ch 7–8"]
  N -->|Yes| M["Mixed-effects models, Ch 10"]
The study’s questions and methods
| Question | Method | Ch |
|---|---|---|
| RQ1 graduate life | plots, descriptive statistics | 4, 6 |
| RQ2 sleep below 7 h | one-sample t-test | 7 |
| RQ3 workshop | t-test; mixed model | 7, 10 |
| RQ4 faculties differ | ANOVA, post-hoc | 7, 8 |
| RQ5 explaining GPA | multiple regression | 8, 13 |
| RQ6 questionnaire | factor analysis, alpha | 9 |
The study’s questions and methods (continued)
| Question | Method | Ch |
|---|---|---|
| RQ7 student profiles | clustering, mixture models | 9, 14 |
| RQ8 change over time | mixed models | 10 |
| RQ9 considering dropout | logistic regression; classification | 8, 11, 12, 15 |
| RQ10 predicting final GPA | regularised regression, boosting | 13 |
| RQ11 challenges in words | text coding with a language model | 18 |
| RQ12 counselling visits | time series forecasting | 16 |
Challenges every researcher meets: data
| Challenge | Response |
|---|---|
| messy data | clean in code, check each step, never touch the raw file |
| missing data | ask why before acting; leavers are rarely random |
| small samples | report effect sizes with intervals; keep models simple; plan power |
Challenges every researcher meets: analysis
| Challenge | Response |
|---|---|
| many tests | decide main analyses in advance; correct; label exploration |
| assumptions | check with plots; robust, non-parametric, or mixed models |
| correlation is not causation | think through confounders; randomise where possible |
| prediction and explanation | different aims, judged differently |
| communication | clear tables and figures; export with write_csv() or write_sav() |
Where to go next
| Topic | For | Packages |
|---|---|---|
| structural equation modelling | CFA, path models | lavaan |
| Bayesian statistics | prior knowledge, full uncertainty | brms, rstanarm |
| survival analysis | time until an event | survival |
| meta-analysis | combining studies | metafor |
| text analysis | words, sentiment, topics | tidytext, quanteda |
| spatial data | maps | sf |
| publication tables | formatted results | gtsummary, modelsummary |
You do not have to learn alone
- free books: R for Data Science, Regression and Other Stories, ISLR, Tidy Modeling with R, Forecasting: Principles and Practice;
- Posit Community and Stack Overflow for questions;
- R-Ladies and local R user groups;
- TidyTuesday: a new dataset every week to practise on.
A clear question with a small reproducible example is a skill, and the same one that makes an AI assistant useful.
In your field: nutrition science
tooth <- ToothGrowth |> mutate(dose = factor(dose))
tooth |> summarise(mean = mean(len), sd = sd(len), n = n(),
                   .by = c(supp, dose))
summary(aov(len ~ supp * dose, data = tooth))
Prepare, describe, model, report: a complete mini-project in a few lines.
Tooth length depends on dose, form, and their combination: orange juice helps more at low doses, not at the highest.
Practical lab: the Chapter 19 project
Download the complete thesis project from the playground.
Run the cleaning and analysis scripts, then render results.qmd.
Practical exercises 1–3: the pipeline
- Change one cleaning rule, render again, and note which numbers change.
- Add a row to Table 1 for students with children.
- Write a reporting sentence with inline numbers for the effect of support on GPA.
Practical exercises 4–6: figures, methods, reasoning
- Add a third panel to the thesis figure: wellbeing by faculty.
- Choose a method for a question from your own field.
- Complete the chain of reasoning for RQ2, sleep below 7 hours.
Try this yourself
For your own thesis:
- set up the project structure today, with a README;
- move the raw data into
data-raw/and make it read-only; - write the chain of reasoning for your main research question;
- decide which reporting standard applies.
Troubleshooting guide (Part 1)
| Symptom | Likely cause |
|---|---|
| the project runs only on your computer | absolute paths; use here::here() |
| a number in the thesis disagrees with the code | typed by hand |
| cleaned data looks wrong but no error | no checks at the end of the cleaning script |
| the same code pasted three times | a helper function is needed |
Troubleshooting guide (Part 2)
| Symptom | Likely cause |
|---|---|
| a causal claim from observational data | the design was ignored in the conclusion |
| an examiner asks what was missing | missing data and attrition not reported |
| the most advanced method chosen by default | choose by goal, outcome, and structure |
| no limitations section | every conclusion has limits; state them |
Completion checklist
Misconceptions to leave behind (Part 1)
| Misconception | Better mental model |
|---|---|
| a significant result answers the question | it is one link; design and measures decide its meaning |
| the discussion should defend the results | it should also state their limits |
Misconceptions to leave behind (Part 2)
| Misconception | Better mental model |
|---|---|
| formatting numbers by hand is quicker | quicker once, wrong the next time |
| choose the most advanced method | choose the simplest that fits the question |
The chapter in one sentence
Build the thesis as one project that runs from the raw data to every number in the text, and keep each result attached to the design and limits that give it meaning.
The whole course in one picture
flowchart TB
  subgraph R1[" "]
    direction LR
    A["A question worth answering"] --> B["Clean, checked data"] --> C["The simplest fitting method"]
  end
  subgraph R2[" "]
    direction LR
    D["Results with size and uncertainty"] --> E["Honest conclusions and limits"]
  end
  R1 --> R2
From data to thesis: every step written in code, every claim traceable.
Questions
What is the first thing you will change in your own project?
Which link in your chain of reasoning is weakest?