flowchart LR
  A["report.qmd<br>text + code"] --> B["knitr runs<br>the R code"] --> C["report.md<br>text + results"] --> D["Pandoc"]
  D --> E[HTML]
  D --> F[Word]
  D --> G[PDF]
Reproducible Research
Reproducible Research
A finding is credible only if it can be checked
Chapter 17
Polla Fattah
By the end of today you can
- explain why reproducibility is a matter of research integrity;
- write a Quarto document with text, code, results, tables, figures, citations, and equations;
- render it to HTML, Word, and PDF;
- keep package versions with renv, and report them;
- build a small Shiny dashboard;
- apply open science practices: sharing, protecting participants, preregistering, citing software.
Three weeks before the deadline
Twelve duplicated students are found in an early version of the survey export.
They were removed in Chapter 3, but some tables were copied into the draft before that.
Now every number copied by hand from R into Word must be checked and replaced, one at a time.
Reproducible and replicable
| Term | Means |
|---|---|
| reproducible | same data and code give exactly the same results |
| replicable | a new study with new data reaches the same conclusions |
Reproducibility is the minimum standard: if results cannot be recomputed, asking whether they replicate is pointless.
Most irreproducibility is everyday friction
- a table copied before the data was corrected;
- a spreadsheet cell edited by hand;
- menu clicks nobody wrote down;
- a package that changed its default.
Habits from earlier chapters already guard against much of this.
Habits you already have
| Habit | Chapter |
|---|---|
| every step written as code | 1 |
| an RStudio Project with relative paths | 1 |
| raw data never edited by hand | 3 |
set.seed() before random steps |
7 |
Today adds the last links: results placed into the report automatically, fixed software versions, and responsible sharing.
Documents that contain their own analysis
Quarto documents (.qmd) mix text and code.
When rendered, the code runs and its numbers, tables, and figures are placed into a web page, Word document, PDF, slide show, or book.
This course’s book and these slides are written in Quarto. R Markdown (.Rmd) is its predecessor, and works almost the same way.
A complete Quarto document
The three parts
| Part | Where | Holds |
|---|---|---|
| YAML header | between the --- lines |
title, author, output format |
| Markdown text | the body | **bold**, *italic*, # Heading, - bullets |
| code chunks | between ```{r} and ``` |
code run when rendering |
File > New File > Quarto Document, then the Render button. A visual editor is also available.
Inline code: numbers never typed by hand
r mean(sleep) inside a sentence is replaced by its result:
My three friends slept 6.3333333 hours on average last night.
If a friend’s number changes, the sentence changes with it. Better still: round(mean(sleep), 1).
This is the cure for the problem three weeks before the deadline.
What happens when you render
The code runs from the beginning every time. Anything created by hand in the Console makes rendering fail: a built-in reproducibility test.
A results chapter in Quarto
---
title: "Chapter 4: Results"
format: docx
bibliography: references.bib
execute:
  echo: false
---

The sample included `r nrow(students)` graduate students from
`r n_distinct(students$faculty)` faculties. @tbl-faculty shows
wellbeing by faculty, which declined as in earlier studies [@author2020].
format: docx gives the Word file supervisors want; echo: false hides the code but keeps it in the .qmd.
A numbered table from code
```{r}
#| label: tbl-faculty
#| tbl-cap: "Wellbeing in the first semester, by faculty."
semesters |>
  filter(semester == 1) |>
  left_join(students, join_by(student_id)) |>
  summarise(Students = n(), Mean = mean(wellbeing, na.rm = TRUE),
            SD = sd(wellbeing, na.rm = TRUE), .by = faculty) |>
  knitr::kable(digits = 1)
```
Chunk options start with #|. A tbl- or fig- label makes a numbered, cross-referenced item.
What the reader sees
The sample included 600 graduate students from 5 faculties. Table 1 shows wellbeing by faculty.
| Faculty | Students | Mean | SD |
|---|---|---|---|
| Education | 148 | 61.9 | 13.2 |
| Health Sciences | 154 | 59.0 | 11.6 |
| Humanities | 95 | 61.7 | 11.7 |
| Natural Sciences | 87 | 61.3 | 10.5 |
| Social Sciences | 116 | 58.9 | 12.1 |
References and citations
@book{kuhn2022,
  author    = {Kuhn, Max and Silge, Julia},
  title     = {Tidy Modeling with R},
  publisher = {O'Reilly Media},
  year      = {2022}
}
[@kuhn2022] in the text becomes a formatted citation, and the reference list is added.
Zotero, Mendeley, and EndNote export BibTeX. A csl: line switches between APA, Vancouver, Harvard, and thousands more.
Equations
\[ \text{logit}(p) = \beta_0 + \beta_1 \times \text{stress} + \beta_2 \times \text{support} \]
LaTeX notation, between dollar signs. The same in HTML, Word, and PDF.
One line changes the output
| Format | YAML | Notes |
|---|---|---|
| web page | format: html |
interactive; for sharing online |
| Word | format: docx |
for comments; reference-doc: applies university styles |
format: pdf |
run quarto install tinytex once |
|
| slides | format: revealjs |
for presentations |
A whole thesis can be a Quarto book, one .qmd per chapter.
Parameterised reports
---
title: "Wellbeing report"
params:
  faculty: "Education"
---

This report describes the students of the Faculty of `r params$faculty`.One report, five deans, five versions.
Packages change
A default changes, or a function disappears, and an analysis that runs today may fail, or give different results, in two years.
renv::init()      # once: the project gets its own library
renv::snapshot()  # after installing or updating: record versions
renv::restore()   # later, or elsewhere: install the recorded versions
renv.lock lists every package and version. Share it with your code.
Report the versions
R 4.4.3, lme4 1.1.37.
Even without renv, name the versions of R and key packages in the methods section.
Shiny: let readers ask their own questions
A report answers its author’s questions. Readers want “what about my faculty?”
| Idea | In Shiny |
|---|---|
| inputs | drop-downs, buttons, sliders |
| outputs | plots, tables |
user interface (ui) |
where inputs and outputs appear |
| server | R code that makes outputs from inputs |
Reactivity
flowchart LR
  F["Input:<br>faculty"] --> S["selected()<br>filter the data"]
  S --> P["Output:<br>trend plot"]
  S --> T["Output:<br>summary table"]
  M["Input:<br>measure"] --> P
  M --> T
When an input changes, Shiny reruns only what depends on it.
The dashboard: data and layout
wellbeing_data <- semesters |>
  left_join(students |> select(student_id, faculty, study_mode),
            join_by(student_id))

ui <- page_sidebar(
  title = "Graduate student wellbeing",
  sidebar = sidebar(
    selectInput("faculty", "Faculty",
                choices = sort(unique(wellbeing_data$faculty))),
    radioButtons("measure", "Measure", choices = measures)),
  card(plotOutput("trend")),
  card(tableOutput("summary")))
The dashboard: server
server <- function(input, output, session) {
  selected <- reactive({
    wellbeing_data |> filter(faculty == input$faculty)
  })
  output$trend <- renderPlot({
    selected() |>
      summarise(mean = mean(.data[[input$measure]], na.rm = TRUE),
                .by = c(semester, study_mode)) |>
      ggplot(aes(semester, mean, colour = study_mode)) + geom_line()
  })
}
shinyApp(ui, server)
reactive() refilters only when the faculty changes. .data[[input$measure]] picks the chosen column.
What the dashboard draws
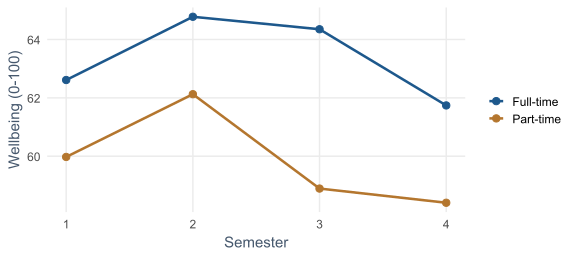
Education, wellbeing. Host on shinyapps.io or Posit Connect; Shinylive runs simple apps in the browser.
Open science: sharing data and code
| Include | Why |
|---|---|
| raw data, or how to obtain it | the starting point |
| cleaning and analysis code | every step |
| the Quarto source | the report itself |
renv.lock |
the software versions |
| a codebook | what each variable means |
OSF and Zenodo give a permanent DOI. A licence (CC BY for data, MIT for code) says what others may do.
Removing names is not enough
Only 3 students are part-time male students with children in Education.
In a small department, such a description may point to recognisable people.
Protecting participants
- group categories or remove unneeded variables;
- share summary data only;
- follow the consent form: if it promised anonymised data, that is all;
- when data cannot be shared, a synthetic dataset lets others run the code.
The garden of forking paths
p <- c(
  t_test         = t.test(score ~ group)$p.value,
  no_outliers    = t.test(score[z < 2] ~ group[z < 2])$p.value,
  log_scale      = t.test(log(score) ~ group)$p.value,
  rank_test      = wilcox.test(score ~ group)$p.value,
  with_covariate = summary(lm(score ~ group + covariate))$coefficients[2, 4])
No real group difference. Five defensible analyses, 2,000 simulated studies.
Choosing afterwards inflates false positives
| Analysis strategy | False positives |
|---|---|
| one planned analysis | 5% |
| best of five, chosen afterwards | 11% |
No individual choice is wrong. The problem is choosing after seeing the result.
Preregistration
- record hypotheses, design, and planned analysis before seeing the data;
- in a time-stamped registry: OSF Registries or AsPredicted;
- confirmatory analyses follow the plan; exploratory ones are labelled as such;
- a registered report is accepted before data collection, whatever the results.
Citing software
Analyses were carried out in R version 4.4.3 [R Core Team], with mixed models fitted using lme4 version 1.1.37 [Bates et al., 2015].
Package authors are researchers who depend on being cited.
In your field: psychology and medicine
In 2015, 100 psychology studies were repeated.
| Originals | Replications | |
|---|---|---|
| significant results | 97% | 36% |
| average effect size | full | about half |
Small samples, flexible analyses, and selective publication. The response: preregistration, registered reports, and sharing. Medicine has required trial registration since 2005.
Keeping a history with git (optional)
| Term | Means |
|---|---|
| repository | a project folder whose history git keeps |
| commit | a saved snapshot with a message |
| push | copy commits to GitHub, also a backup |
| pull | bring down changes made elsewhere |
RStudio’s Git pane uses buttons. usethis::use_git() and usethis::use_github() set it up. List private data in .gitignore.
Practical lab: the Chapter 17 playground
Work through the playground exercises in your browser, with hints and solutions.
The Quarto and Shiny exercises run in RStudio from the downloadable project.
Practical exercises 1–3: Quarto
- Render the tiny document, change a value, and round with inline code.
- Turn an earlier analysis into a report with a numbered table and figure.
- Add references, cite them, and switch the citation style.
Practical exercises 4–6: Shiny and open science
- Add a slider for the semesters shown in the dashboard.
- Which variable would you remove or group before sharing, and why?
- Add a sixth analysis to
forking_paths(): what happens to false positives?
Try this yourself
Take one results paragraph from your own thesis draft.
- find every number typed by hand;
- replace each with inline code;
- give each table and figure a label and a cross-reference;
- render to Word, change the data, and render again.
Troubleshooting guide (Part 1)
| Symptom | Likely cause |
|---|---|
| rendering fails, the Console works | code relies on an object made by hand |
| a number in the text is out of date | typed by hand instead of inline code |
| “Table ??” in the output | label lacks the tbl- prefix |
| PDF will not render | LaTeX missing; quarto install tinytex |
Troubleshooting guide (Part 2)
| Symptom | Likely cause |
|---|---|
| different results on another computer | package versions differ; use renv |
| a Shiny output never updates | it does not use the input it should |
| shared data identifies people | small cells not protected |
| a “significant” result after many tries | forking paths; preregister |
Completion checklist
Misconceptions to leave behind (Part 1)
| Misconception | Better mental model |
|---|---|
| reproducibility means sharing code | every step, decision, and version |
| copying a few numbers is harmless | the most common way a thesis drifts |
Misconceptions to leave behind (Part 2)
| Misconception | Better mental model |
|---|---|
| defensible choices give sound results | choosing afterwards inflates false positives |
| removing names makes data anonymous | combinations can identify people |
The chapter in one sentence
Keep text, code, and results together so the whole report rebuilds from the raw data with one command, and share it in a way others can check and participants can trust.
Next: Chapter 18
The next chapter looks at AI in research:
- the reliability of coding, and Cohen’s kappa;
- how AI assistants work;
- AI as a coding assistant;
- coding open-ended answers with a language model;
- using AI responsibly.
Questions
How many numbers in your current draft were typed by hand?
What would it take to rebuild your results from the raw data tomorrow?