Hypothesis Testing and Statistical Inference
Hypothesis Testing and Statistical Inference
From the students we measured to the students we mean
Chapter 7
Polla Fattah
By the end of today you can
- explain a sampling distribution and the standard error;
- calculate and interpret a confidence interval, including a bootstrap interval;
- explain a p-value through a permutation test;
- describe Type I and Type II errors, power, and multiple testing;
- run one-sample, two-sample, and paired t-tests in SciPy;
- measure the size of an effect with Cohen’s d;
- judge assumptions and choose a non-parametric test when they fail;
- test categorical relationships with chi-square tests;
- report a test in a thesis.
Two research questions from Chapter 5
RQ2: do graduate students sleep less than the recommended 7 hours?
RQ3: did the wellbeing workshop improve wellbeing?
Both are questions about all graduate students.
The student wellbeing data holds 600 of them.
Population, sample, parameter, statistic
| Term | Meaning | Example |
|---|---|---|
| population | everyone the conclusion covers | all graduate students |
| sample | the people actually measured | the 600 students in the data |
| parameter | a number describing the population | true average sleep |
| statistic | the same number from the sample | average sleep of the 600 |
The parameter is never known exactly. The statistic is our estimate of it.
The question inference answers
sample statistic  ───────>  population parameter
       6.42 hours                 ???
How close is 6.42 to the true number for everyone?
Could the difference from 7 hours be chance?
A thought experiment with caffeine
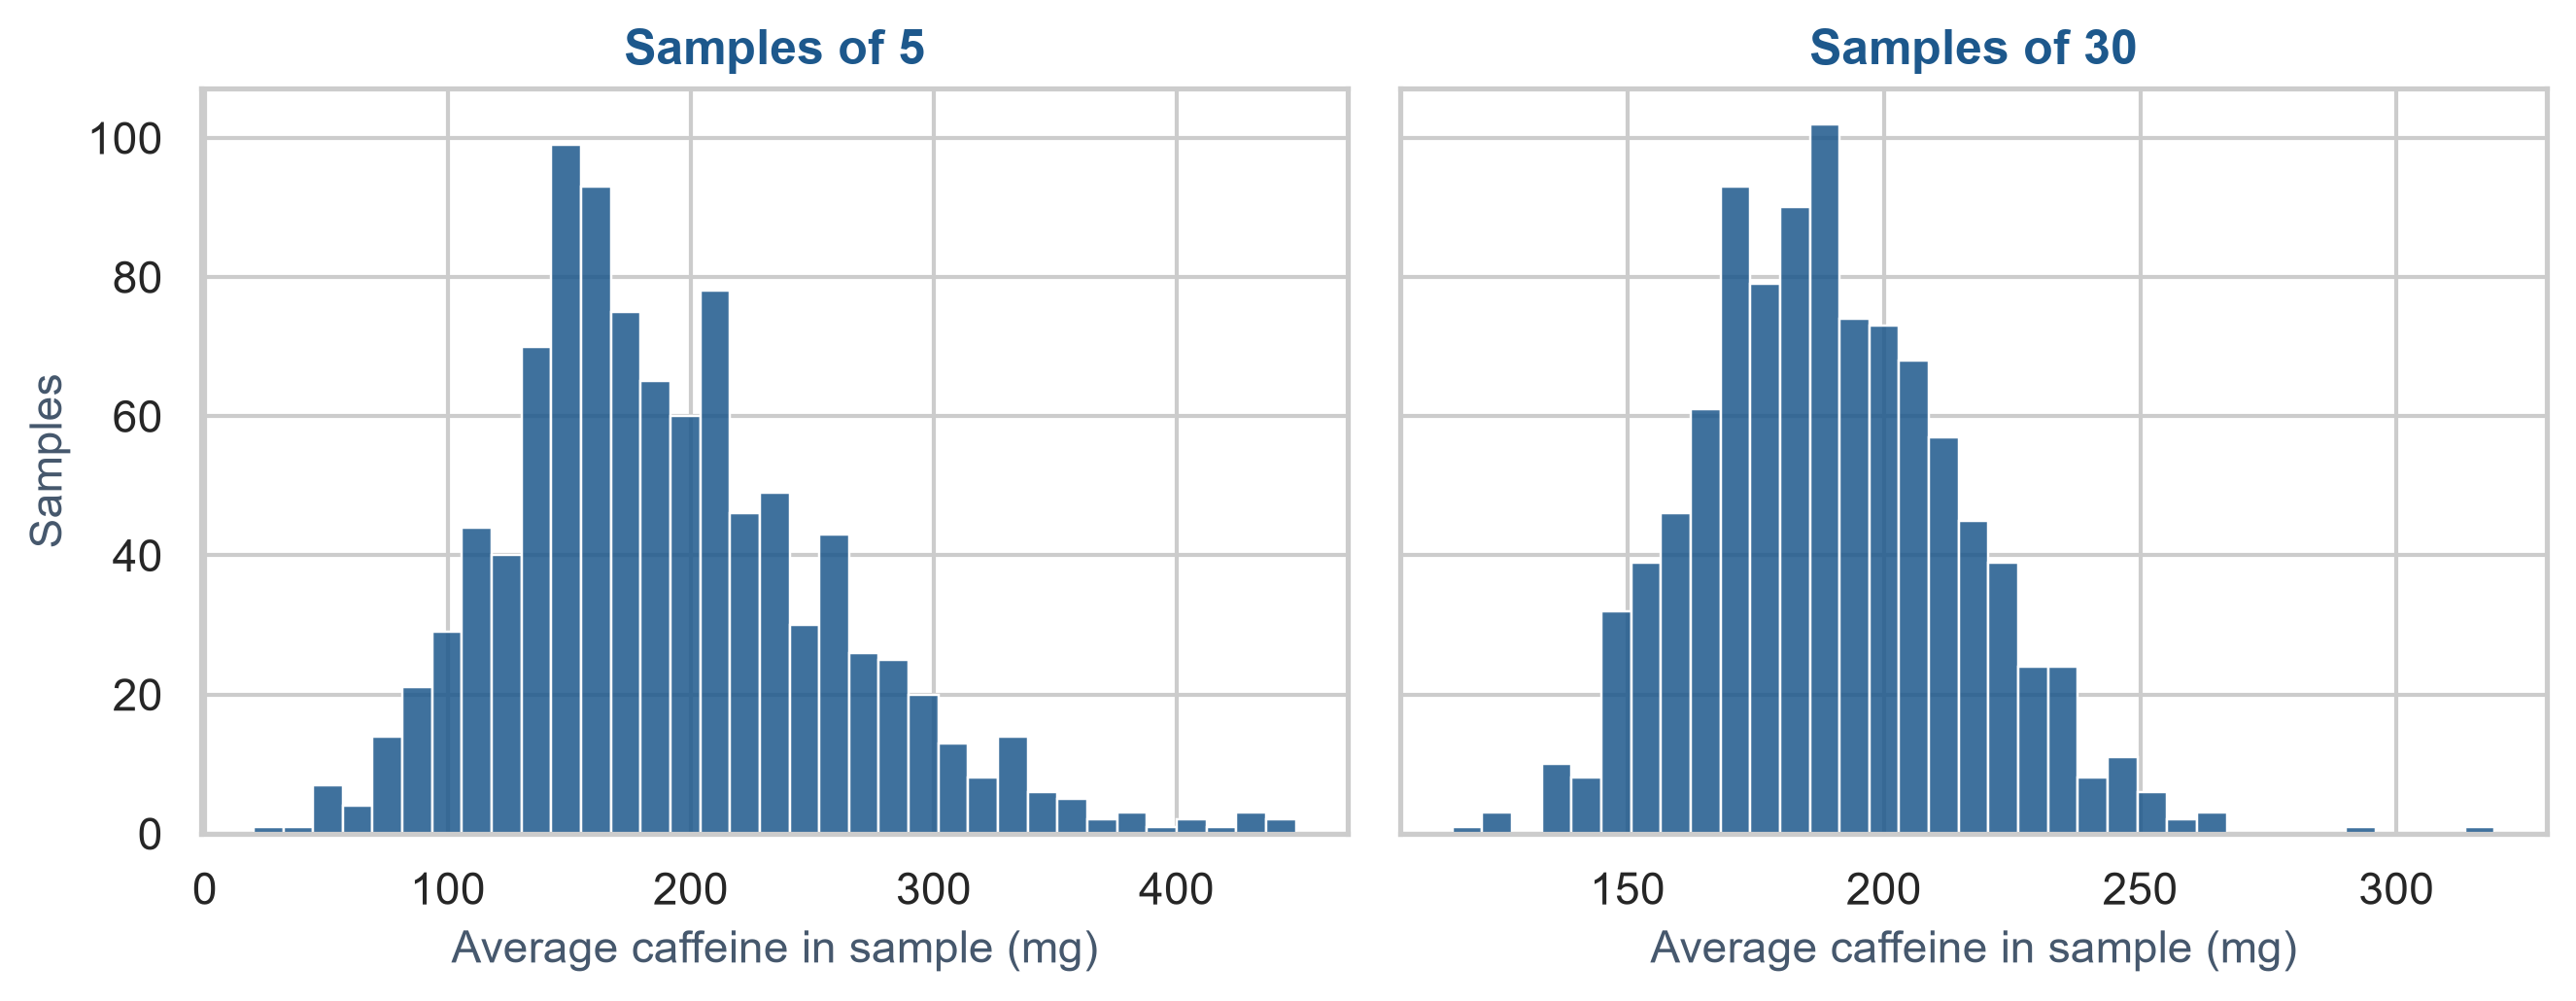
Imagine taking five students at random and averaging their caffeine.
Repeat that 1,000 times.
Then do it with samples of 30.
Sampling in Python
np.random.seed(2026)

means_5 = [np.random.choice(caffeine, 5).mean() for _ in range(1000)]
means_30 = [np.random.choice(caffeine, 30).mean() for _ in range(1000)]
np.random.seed() makes the pseudo-random samples reproducible every time the code runs.
A sampling distribution
The distribution of a statistic over many possible samples is its sampling distribution.
Three lessons in one picture
- Both distributions centre on the average of all 600 students, 202 mg: the sample mean is unbiased.
- Averages of 30 are packed far more tightly: larger samples are more precise.
- Caffeine is skewed, yet averages of 30 are nearly bell-shaped.
The third lesson has a name.
The Central Limit Theorem
As sample size grows, the distribution of the sample mean approaches normal, even if the raw data is heavily skewed.
By \(n = 30\), most means are nearly normal.
By \(n = 100\), almost all are.
The standard error: how much the mean moves
The standard deviation of that sampling distribution is the standard error (SE):
\[\text{SE} = \frac{s}{\sqrt{n}}\]
| Measure | Tells you |
|---|---|
| standard deviation (\(s\)) | how spread out individual students are |
| standard error (\(\text{SE}\)) | how uncertain the sample mean is |
As \(n\) quadruples, the SE halves.
Standard error in Python
# For first-semester sleep hours (n = 600)
sleep = first_sem["sleep_hours"].dropna()

se = sleep.std(ddof=1) / np.sqrt(len(sleep))
# Or using pandas built-in:
se = sleep.sem()
print(f"SE: {se:.4f}")
Sleep standard deviation: 1.19 hours.
Standard error with \(n = 600\): 0.049 hours (under 3 minutes).
A single number is never the whole answer
"Average sleep was 6.42 hours."Could it have been 6.2? 6.6? 7.0?
A point estimate gives no sense of uncertainty.
A confidence interval gives the plausible range.
The 95% confidence interval
Under the Central Limit Theorem, about 95% of sample means lie within roughly 1.96 standard errors of the true mean:
\[\bar{x} \pm t^* \times \text{SE}\]
For \(n = 600\), \(t^* \approx 1.96\).
Calculating the interval
from scipy import stats

ci = stats.t.interval(
    confidence=0.95,
    df=len(sleep) - 1,
    loc=sleep.mean(),
    scale=sleep.sem()
)
print(f"95% CI: [{ci[0]:.2f}, {ci[1]:.2f}]")
Output: [6.33, 6.52] hours.
Every plausible value in the interval is below 7.
What 95% actually means
| Misconception | What is true |
|---|---|
| “There is a 95% chance the true mean is between 6.33 and 6.52.” | The true mean is a fixed number; it is not moving. |
| “95% of students sleep between 6.33 and 6.52 hours.” | That is the standard deviation’s job, not the SE’s. |
| Correct | If we repeated the study many times, 95% of the calculated intervals would capture the true mean. |
The bootstrap interval: no formula needed
When assumptions are uncertain, build the interval by resampling the sample with replacement:
np.random.seed(2026)
boot_means = [
    sleep.sample(frac=1.0, replace=True).mean()
    for _ in range(5000)
]

boot_ci = np.percentile(boot_means, [2.5, 97.5])
print(f"Bootstrap 95% CI: [{boot_ci[0]:.2f}, {boot_ci[1]:.2f}]")
Result: [6.33, 6.52] — identical to the formula, but without assuming normality.
The logic of hypothesis testing
Four steps, every time:
- State a null hypothesis (\(H_0\)) and an alternative (\(H_1\)).
- Choose a test statistic.
- Compare the observed statistic to what chance would produce under \(H_0\).
- Decide how surprising the result is (the p-value).
The null and the alternative
H0 (null):         the workshop has no effect on wellbeing
H1 (alternative):  the workshop changes wellbeing
\(H_0\) is the “nothing to see here” baseline.
We assume \(H_0\) is true until the data forces us to reconsider.
Proving the logic with a shuffle
If the workshop does nothing (\(H_0\)), the labels “Invited” and “Not invited” are meaningless stickers.
We could peel them off, shuffle them, stick them back on, and calculate the difference in means again.
Any difference after shuffling is pure chance.
Shuffling in Python
np.random.seed(2026)
wellbeing_all = semester2["wellbeing"].to_numpy()
n_inv = (semester2["workshop"] == "Invited").sum()

shuffled_gaps = []
for _ in range(5000):
    shuffled = np.random.permutation(wellbeing_all)
    diff = shuffled[:n_inv].mean() - shuffled[n_inv:].mean()
    shuffled_gaps.append(diff)
shuffled_gaps = np.array(shuffled_gaps)
np.random.permutation() randomly scrambles the values across the groups.
The observed gap against 5,000 shuffles
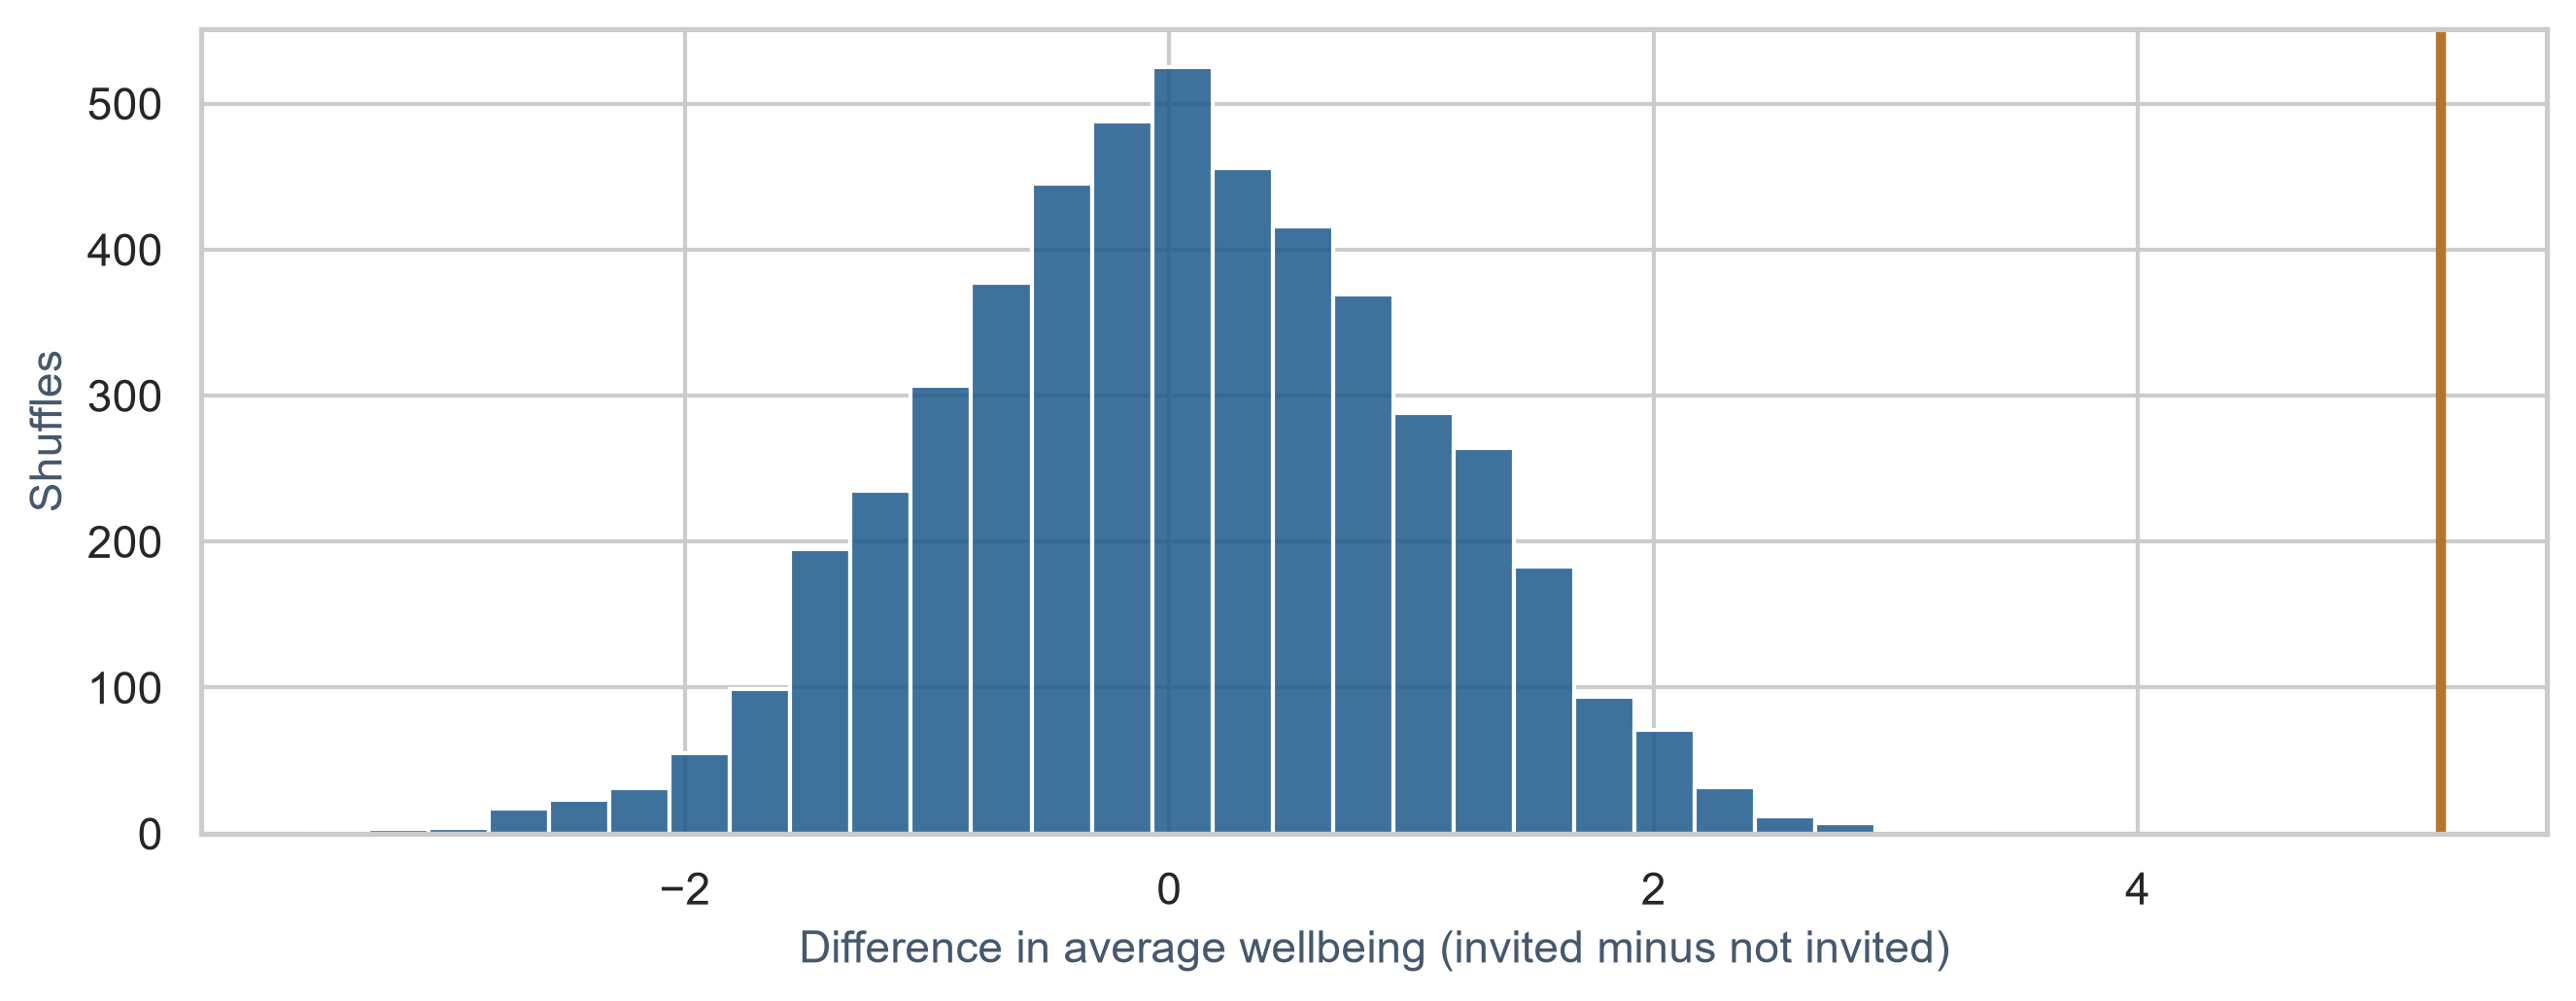
Chance gaps cluster around zero. The observed gap (copper line at 6.2 points) is far beyond all of them.
The p-value, by counting
The share of shuffles at least as extreme as the observed gap is the p-value.
Not one of 5,000 shuffles matched it, so we report p < .001, not p = 0.
A test that finds nothing
gpa_f = first_sem.loc[first_sem["gender"] == "Female", "gpa"]
gpa_m = first_sem.loc[first_sem["gender"] == "Male", "gpa"]
gpa_gap = gpa_f.mean() - gpa_m.mean()
GPA gap between female and male students: 0.03 points.
Shuffling produces gaps this large roughly 50% of the time.
p ≈ 0.50: consistent with pure chance.
What a p-value is, and what it is not
| What it is NOT | What it IS |
|---|---|
| the probability \(H_0\) is true | \(P(\text{data at least this extreme} \mid H_0)\) |
| the probability of making an error | a summary of how surprising the data is under \(H_0\) |
| the size of the effect | a number between 0 and 1 |
A tiny p-value can come from a tiny effect in a huge sample.
The two mistakes you can make
| Reality | You say “difference” (\(p < .05\)) | You say “no difference” (\(p \ge .05\)) |
|---|---|---|
| \(H_0\) is true | Type I error (false positive, \(\alpha = 0.05\)) | correct decision |
| \(H_1\) is true | correct decision (power, \(1 - \beta\)) | Type II error (false negative, \(\beta\)) |
Setting \(\alpha = 0.05\) accepts a 1-in-20 chance of false alarm.
Statistical power
Power is the chance of finding an effect when it is really there.
Power depends on three things:
- sample size: bigger samples see smaller effects;
- effect size: big effects are easier to detect;
- significance level (\(\alpha\)): usually 0.05.
Target in thesis research: at least 80% power.
Power by simulation
def simulate_experiment(n_per_group=80, delta=5, sd=11):
    inv = np.random.normal(loc=65, scale=sd, size=n_per_group)
    not_inv = np.random.normal(loc=60, scale=sd, size=n_per_group)
    res = stats.ttest_ind(inv, not_inv, equal_var=False)
    return res.pvalue < 0.05
Imagine the true workshop effect is 5 points. Run the study 2,000 times per group size and count the successes.
Power grows with the sample
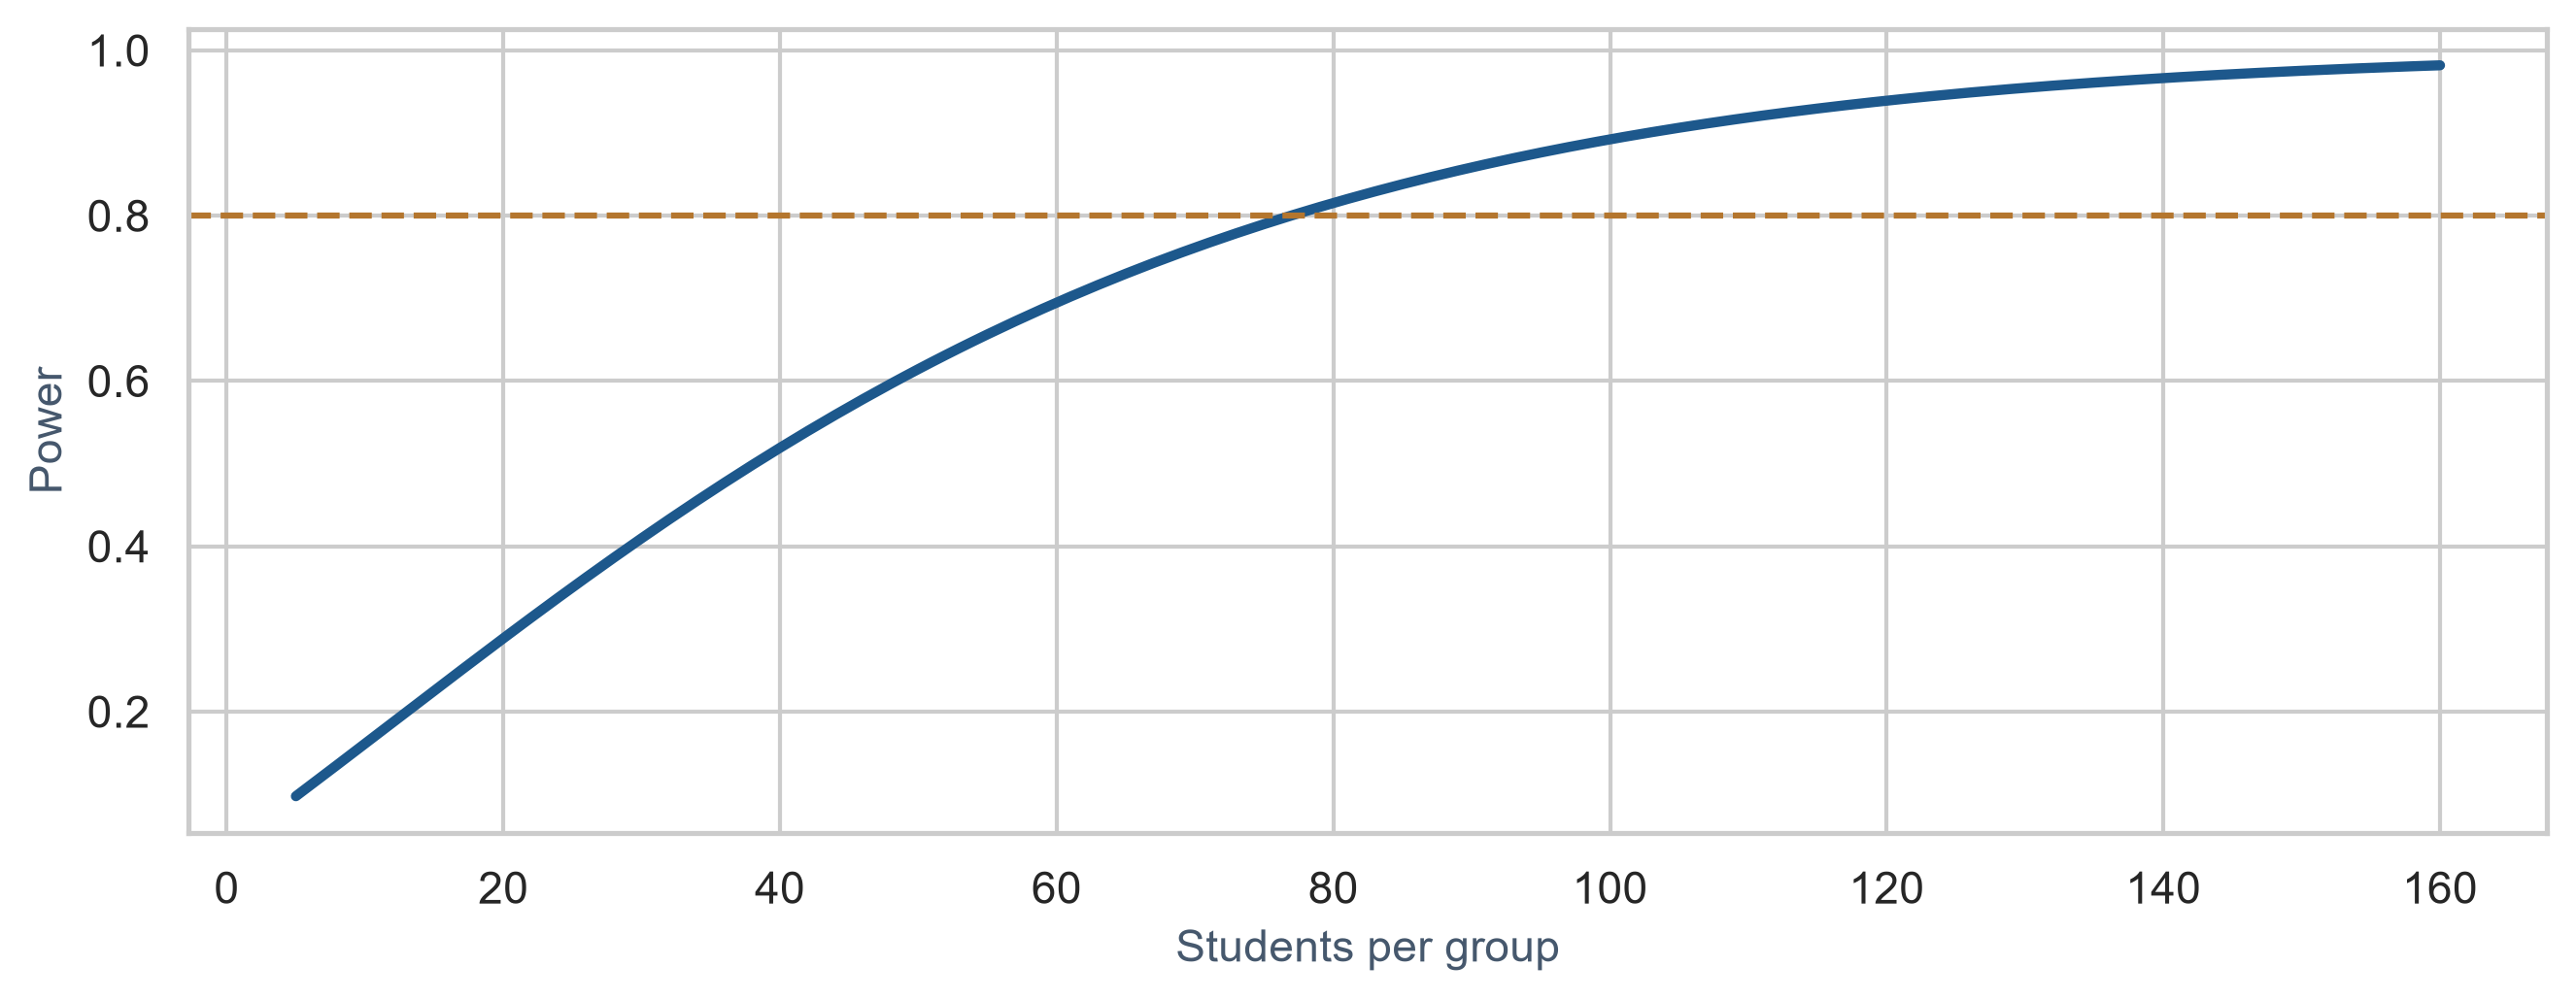
About 80 per group reach 80% power. With 10 per group, the real effect is usually missed.
Read small non-significant studies with caution
10 per group   → power ≈ 0.16
80 per group   → power ≈ 0.80
300 per group  → power ≈ 1.00
“No significant difference” from a small study may describe the study, not the effect.
TTestIndPower().solve_power() in statsmodels computes power analytically.
Multiple testing: the 20-test trap
If you run 20 independent tests on noise, each at \(\alpha = 0.05\):
\[P(\text{at least one false positive}) = 1 - (1 - 0.05)^{20} \approx 64\%\]
Looking at 20 variables and reporting only the one that worked is p-hacking.
Controlling the family-wise error
from statsmodels.stats.multitest import multipletests

raw_p = [0.004, 0.012, 0.038, 0.150, 0.420]
reject, p_bonf, _, _ = multipletests(raw_p, method="bonferroni")
reject, p_fdr, _, _ = multipletests(raw_p, method="fdr_bh")- Bonferroni: multiply each p-value by the number of tests;
- Benjamini-Hochberg (FDR): controls the share of false discoveries, more powerful.
The one-sample t-test: sleep vs 7 hours
\[t = \frac{\bar{x} - \mu_0}{\text{SE}} = \frac{6.42 - 7}{0.0487} = -11.96\]
Result: \(t(599) = -11.96\), \(p < .001\).
Graduate students sleep significantly less than 7 hours.
The two-sample t-test: comparing groups
\[\text{Welch's } t = \frac{\bar{x}_1 - \bar{x}_2}{\sqrt{\frac{s_1^2}{n_1} + \frac{s_2^2}{n_2}}}\]
Always use Welch’s t-test (equal_var=False).
Student’s original test assumed equal variances in the two groups. Welch’s does not, and gives almost identical results when they are equal.
Look before you test
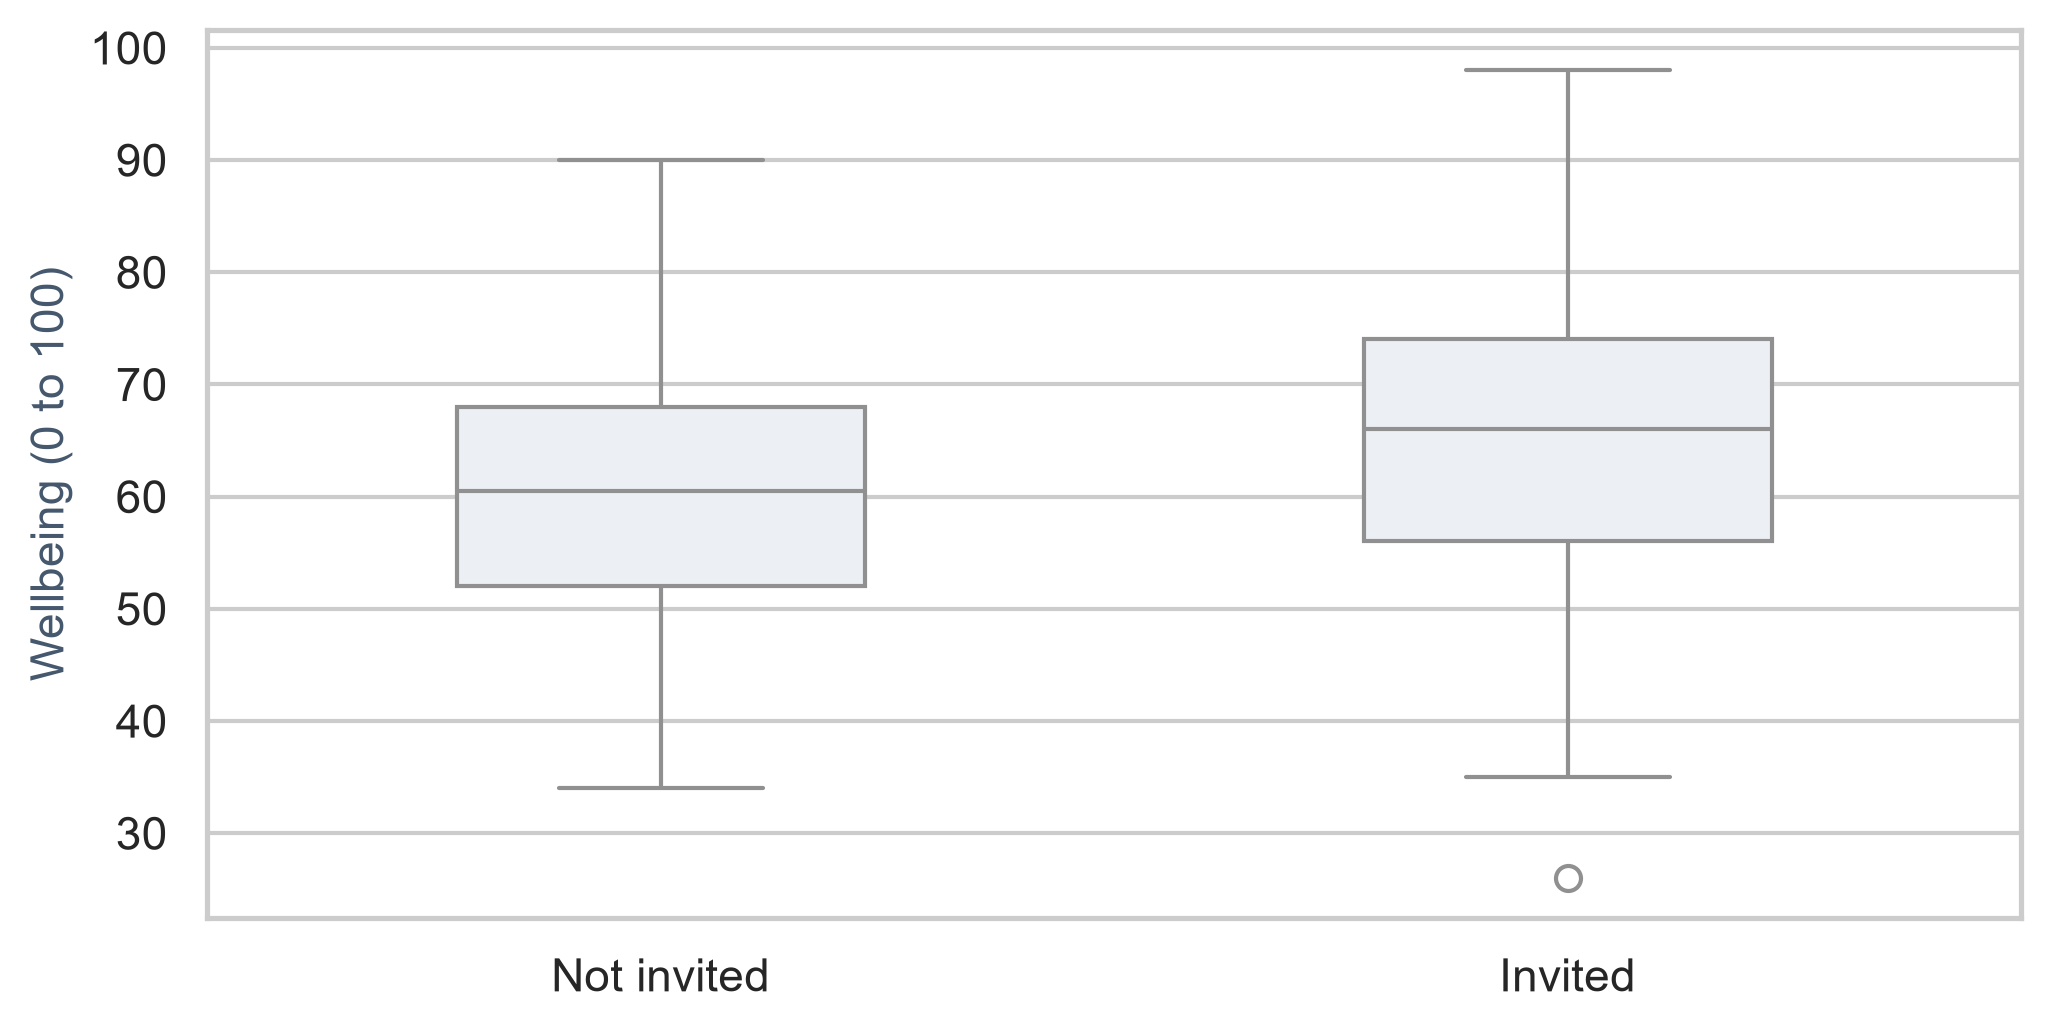
The invited group sits higher, but the groups overlap considerably.
Testing the workshop
result = stats.ttest_ind(inv, not_inv, equal_var=False)
ci = result.confidence_interval(confidence_level=0.95)
print(f"t = {result.statistic:.2f}, p = {result.pvalue:.4e}")
print(f"95% CI of difference: [{ci.low:.2f}, {ci.high:.2f}]")
Gap: 6.2 points, 95% CI [4.4, 8.0], \(p < .001\), in exact agreement with the shuffling test.
Randomisation allows a causal conclusion
flowchart TD
    A["Workshop invitation (random)"] --> B["Higher wellbeing"]
    C["Age, gender, baseline stress"] -.->|balanced by randomisation| A
Because the invitation was random, confounders balance across groups.
We can claim the workshop caused the higher wellbeing.
Effect size: how big is the difference?
A p-value answers “is there evidence of a difference?”
Cohen’s d answers “how big is the difference, in standard deviations?”
\[d = \frac{\bar{x}_1 - \bar{x}_2}{s_{\text{pooled}}}\]
| d | Rule of thumb |
|---|---|
| 0.2 | small |
| 0.5 | medium |
| 0.8 | large |
Cohen’s d in Python
s_pooled = np.sqrt(
    ((len(inv) - 1) * inv.var(ddof=1) + (len(not_inv) - 1) * not_inv.var(ddof=1))
    / (len(inv) + len(not_inv) - 2)
)
d = (inv.mean() - not_inv.mean()) / s_pooled
print(f"Cohen's d: {d:.2f}")
The workshop: \(d \approx 0.56\), medium effect size.
A real improvement, not a transformation, and worthwhile for a six-week workshop.
The paired t-test compares people with themselves
When the same students are measured twice, the two sets of scores are paired.
Comparing each student with themselves removes the large differences between students.
The test becomes more sensitive.
Paired data needs one row per student
# Pivot wellbeing across semesters 1 and 2
invited_wide = (
    semesters.query("semester in [1, 2]")
    .merge(students, on="student_id")
    .query("workshop == 'Invited'")
    .pivot(index="student_id", columns="semester", values="wellbeing")
    .rename(columns={1: "sem_1", 2: "sem_2"})
    .dropna()
)

res_paired = stats.ttest_rel(invited_wide["sem_2"], invited_wide["sem_1"])
print(f"t = {res_paired.statistic:.2f}, p = {res_paired.pvalue:.4e}")
A paired test cannot say why
flowchart TD
    A["Invited students improved"] --> B["The workshop worked?"]
    A --> C["Semester 2 was easier for everyone?"]
The paired test has no comparison group.
The two-sample test, invited against not invited, answers the causal question.
The assumptions of the t-test
| Assumption | How to check |
|---|---|
| independence | the study design; one value per person |
| approximate normality | histogram and Q-Q plot; matters little with 30+ per group |
| similar spread | only for classic Student t; Welch does not need it |
Independence cannot be tested. It must be secured when the data is collected.
The trap in normality tests
stat, p_val = stats.shapiro(first_sem["sleep_hours"].dropna())
print(f"Shapiro-Wilk p = {p_val:.4e}")
Shapiro-Wilk rejects normality (\(p < .001\)), yet sleep’s histogram looked almost perfectly normal.
With 600 students the test detects tiny, harmless departures.
In small samples, where normality matters, it misses real problems. Trust the graphs.
Non-parametric tests compare ranks
When data is skewed and the sample small, or the data is ordinal, compare ranks instead of values.
Extreme values and skew no longer distort the result.
The price: a little less power when the data is close to normal.
Rank-based replacements
| Parametric | Non-parametric | In Python (scipy.stats) |
|---|---|---|
| two-sample t-test | Mann-Whitney U | stats.mannwhitneyu(x, y) |
| paired t-test | Wilcoxon signed-rank | stats.wilcoxon(x2, x1) |
Report medians alongside a rank-based test.
Mann-Whitney on skewed caffeine
first_sem.groupby("gender")["caffeine_mg"].median()

caf_f = first_sem.loc[first_sem["gender"] == "Female", "caffeine_mg"].dropna()
caf_m = first_sem.loc[first_sem["gender"] == "Male", "caffeine_mg"].dropna()

res_mw = stats.mannwhitneyu(caf_f, caf_m)
print(f"Mann-Whitney p = {res_mw.pvalue:.3f}")
The medians differ a little, but \(p > 0.05\): no clear evidence of a difference.
When the two kinds of test agree
The Wilcoxon signed-rank test on the invited students agrees with the paired t-test.
When they agree, either can be reported with confidence.
When they disagree, look at the data again, and trust the test whose assumptions fit.
Chi-square tests compare counts
The t-test compares averages of a continuous number.
The chi-square test (\(\chi^2\)) compares counts in categories against the counts expected under \(H_0\).
Goodness of fit: expected proportions
gender_counts = students["gender"].value_counts()
res_chi1 = stats.chisquare(f_obs=gender_counts)
print(f"chi2 = {res_chi1.statistic:.2f}, p = {res_chi1.pvalue:.3f}")
The split is a little uneven (306 vs 294), but \(p = 0.62\).
No evidence against 50/50, and a non-significant result is still a result.
Independence: are two categories related?
jobs = pd.crosstab(students["employment"], students["considering_dropout"])
prop_jobs = pd.crosstab(
    students["employment"],
    students["considering_dropout"],
    normalize="index"
).round(2)
print(prop_jobs)
normalize='index' turns counts into proportions within each row.
About a quarter of full-time workers have considered dropping out, against about one in eight of the others.
Testing the relationship
chi2_stat, p_val, dof, expected = stats.chi2_contingency(jobs)
print(f"chi2({dof}) = {chi2_stat:.2f}, p = {p_val:.4f}")
\(p = .001\): students with full-time jobs are significantly more likely to consider dropping out.
An association, not proof of cause: full-time workers may differ in other ways, such as financial pressure.
Check the expected counts
The chi-square test is reliable when every expected count is at least 5.
When some are not, use Fisher’s exact test (scipy.stats.fisher_exact).
Choosing a test
flowchart TD
  A[What is the outcome?] -->|Numeric| B{How many groups?}
  A -->|Categorical| K[Chi-square test]
  B -->|One, against a value| C[One-sample t-test]
  B -->|Two| D{Same people twice?}
  B -->|Three or more| F[ANOVA, Chapter 8]
  D -->|No| G[Two-sample t-test]
  D -->|Yes| H[Paired t-test]
  G -.->|skewed, small, or ordinal| I[Mann-Whitney U]
  H -.->|skewed, small, or ordinal| J[Wilcoxon signed-rank]
The tests in Python
| Question | Test | In Python (scipy.stats) |
|---|---|---|
| a mean equal to a value? | one-sample t | stats.ttest_1samp(x, popmean=) |
| two groups differ? | two-sample t (Welch) | stats.ttest_ind(x, y, equal_var=False) |
| same people differ? | paired t | stats.ttest_rel(x2, x1) |
| counts match proportions? | goodness of fit | stats.chisquare(f_obs, f_exp=) |
| two categories related? | independence | stats.chi2_contingency(table) |
What a report contains
- the statistic and its degrees of freedom;
- the p-value: exact to two or three decimals, or p < .001;
- the size of the effect with a confidence interval;
- a return to the hypothesis stated in advance.
The effect size matters most.
Writing it up
Invited students reported higher wellbeing (M = 64.9, SD = 10.8) than those not invited (M = 58.7, SD = 11.2), a difference of 6.2 points, 95% CI [4.4, 8.0], Welch’s t(597.1) = 6.84, p < .001, Cohen’s d = 0.56.
Format numbers consistently so they cannot drift from the analysis.
In your field: health research
# Student's historic sleep dataset
drug1 = sleep.loc[sleep["group"] == 1, "extra"]
drug2 = sleep.loc[sleep["group"] == 2, "extra"]
res_sleep = stats.ttest_rel(drug2, drug1)
print(f"t = {res_sleep.statistic:.2f}, p = {res_sleep.pvalue:.3f}")
The t-test was invented for small medical experiments. The sleep data: 10 patients, two drugs, the same patients on both.
A clear effect of 1.58 hours (\(t(9) = 4.06, p = 0.003\)), but a wide interval from 10 patients.
Practical lab: the Chapter 7 playground
Work through the playground exercises in your browser, with hints and solutions.
The lab rebuilds today’s ideas by hand before using the formal tests.
Practical exercises 1–3: estimates and intervals
- Draw sampling distributions of
study_hoursfor samples of 10 and 50. - Build and interpret a 95% interval for first-semester GPA.
- Test whether average wellbeing differs from 60.
Say in one sentence what each result means.
Practical exercises 4–6: tests and power
- Compare full-time and part-time GPA by shuffling, then by Welch’s t-test, with Cohen’s d.
- Find the power of 40 per group for a 3-point effect using
TTestIndPower. - Test whether living away from family is related to considering dropout with \(\chi^2\) and Cramér’s V.
Try this yourself
Choose one comparison in the student wellbeing data that interests you.
- state \(H_0\) and \(H_1\) before looking;
- plot the groups;
- run a permutation test and the matching formal test;
- report the effect size with its interval.
Then explain whether the design allows a causal claim.
Troubleshooting guide (Part 1)
| Symptom | Likely cause |
|---|---|
| results change on every run | no np.random.seed() before random steps |
| p-value looks too small | the same students counted several times |
| “mean ± SE” in the table | SE mistaken for a confidence interval |
| a significant result in a large study seems trivial | significance mistaken for importance |
Troubleshooting guide (Part 2)
| Symptom | Likely cause |
|---|---|
| Shapiro-Wilk rejects a normal-looking variable | a large sample detects harmless departures |
| expected counts below 5 | use scipy.stats.fisher_exact |
| a paired test used for two different groups | the design is independent, not paired |
| many tests, one “finding” | multiple testing without FDR or Bonferroni correction |
Completion checklist
Misconceptions to leave behind (Part 1)
| Misconception | Better mental model |
|---|---|
| the p-value is the chance \(H_0\) is true | the chance of data this extreme if \(H_0\) is true |
| non-significant means no effect | a small study can miss a real effect |
| significant means important | the effect size answers importance |
Misconceptions to leave behind (Part 2)
| Misconception | Better mental model |
|---|---|
| p = 0.049 and p = 0.051 differ | almost identical evidence |
| normality tests decide if a t-test is allowed | graphs and sample size are the better guide |
| many tests at \(\alpha = 0.05\) are harmless | the risks accumulate |
The chapter in one sentence
A test asks how surprising the data would be if nothing were going on; report how big the effect is, not only whether it is significant.
Next: Chapter 8
The next chapter extends comparisons to:
- three or more groups with ANOVA;
- corrections for multiple comparisons;
- linear regression and adjustment;
- logistic regression for yes-or-no outcomes.
Questions
For your own thesis question, what is \(H_0\)?
What result would count as evidence against your expectation?